Run rate determines scoring speed in T20 cricket. Teams need to score at specific rates to post competitive totals.
A run rate above 10 per over produces 200+ totals. Anything above 11 per over creates 220+ scores.
Mumbai Indians have achieved run rates between 10.75 and 12.35 in their twelve biggest totals. This shows consistent fast scoring ability.
Run rate reveals batting efficiency better than raw totals. Two teams can score 220 runs with different run rates.
One team might use all 20 overs. Another might reach the same total in 18 overs.
The difference matters significantly. Faster run rates indicate dominant batting performances.
MI’s fastest run rate stands at 12.35 per over. This came when they scored 247/9 in 20 overs.
Their slowest run rate in this list is 10.75. This produced 215/7 in the full 20 overs.
Both totals exceeded 215 runs. Yet the scoring speeds differed by 1.6 runs per over.
Overconsumption affects match strategy. Teams finishing innings early show complete dominance.
Using all 20 overs shows sustained aggression. Both approaches work depending on mthe atch situations.
Understanding run rate patterns helps analyze batting performances accurately. Numbers reveal how quickly teams scored their big totals.
Highest MI Scores In IPL History
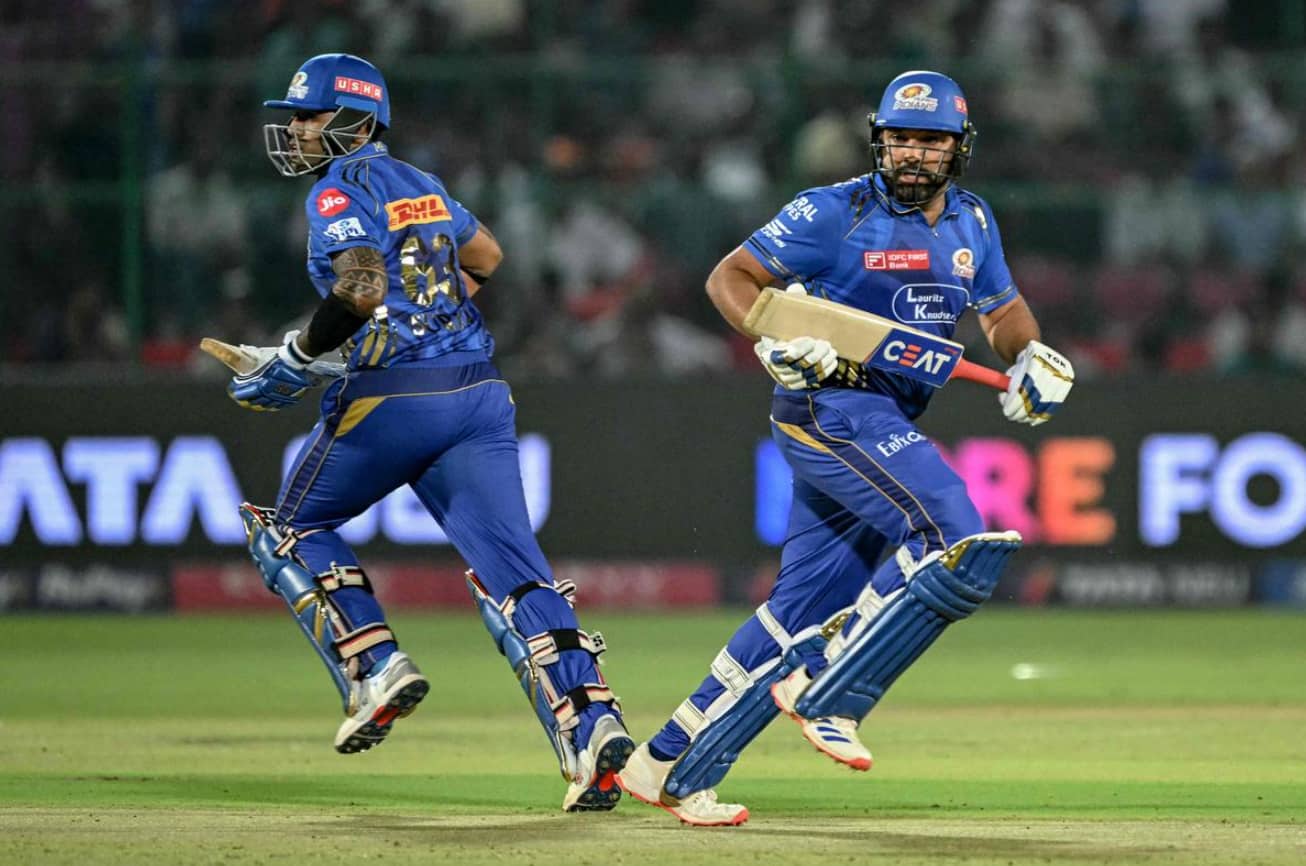
This analysis examines scoring speeds across MI’s highest totals. We compare run rates, over usage, and scoring efficiency.
Statistical breakdowns show which matches featured fastest scoring. Over-wise data reveals batting patterns clearly.
Importance of Run Rate in T20 Cricket
Run rate measures runs scored per over. Simple division of total runs by overs faced gives this number.
A 10 per over rate produces 200 runs in 20 overs. An 11 per over rate yields 220 runs.
Higher run rates put more pressure on opposition. Fast scoring forces defensive field placements.
Bowlers struggle when run rate crosses 12 per over. They lose control and resort to defensive tactics.
MI achieved 12+ run rates twice in their history. Both came in the 2024 season.
The 12.35 rate produced 247/9 against DC. The 12.30 rate generated 246/5 against SRH.
These remain MI’s fastest scoring performances ever. Both crossed 12 runs per over threshold.
Lower run rates around 10.75-10.90 still produced 215-218 totals. Sustained scoring over 20 overs works too.
Consistency matters as much as speed. Maintaining 10+ rates throughout 20 overs requires discipline.
Run Rate Comparison Across All Big Scores
The 247/9 against DC had 12.35 run rate. This stands as MI’s fastest scoring performance.
The 246/5 against SRH showed 12.30 run rate. Just 0.05 slower than the fastest.
Both these scores came within one month in 2024. March and April 2024 saw MI’s peak scoring rates.
The 235/9 against SRH had 11.75 run rate. This represents third-fastest scoring.
Fourth fastest was 234/5 against DC at 11.70 rate. Another 2024 performance.
The 228/5 against GT produced 11.40 run rate. Fifth-fastest scoring rate.
MI highest score chase in IPL includes the 216/4 against Punjab. This had 11.46 run rate in just 18.5 overs.
The 223/6 against Kings XI showed 11.15 rate. Seventh-fastest among big scores.
Three scores shared 10.90 run rate. These were 219/6, 218/7, and 218/5.
The 217/2 against RR had 10.85 rate. Second-slowest among the twelve totals.
Slowest was 215/7 against LSG at 10.75 rate. Still crossed the crucial 10 per over mark.
Fastest vs Slowest Scoring Analysis
Run rates above 12 per over are extremely rare. MI achieved this only twice.
Both occasions resulted in losses. The 247/9 and 246/5 couldn’t secure victories.
This shows fast scoring alone doesn’t guarantee wins. Match outcomes depend on bowling too.
Run rates between 11.40-11.75 produced mixed results. Some won, some lost.
The 235/9 with 11.75 rate won the match. The 223/6 with 11.15 rate lost.
Rates between 10.75-10.95 showed better win percentage. Seven matches in this range produced six wins.
Slower sustained scoring proved more successful. Consistent 10.8-11.0 rates worked better than extreme speed.
The 217/2 scored at 10.85 rate and won. The 215/7 at 10.75 rate also won.
Both demonstrated that 10.7+ rates suffice for 215+ totals. Extreme aggression isn’t always necessary.
Overconsumption Patterns
Eleven matches used all 20 overs completely. Only one finished earlier.
The 216/4 against Punjab took 18.5 overs. This saved 7 balls while chasing.
All batting-first performances used the full 20 overs. Teams maximized their allocation.
Chasing performances showed different patterns. Four used all 20 overs, one finished early.
The early finish came while successfully chasing 217. MI won with 7 balls remaining.
Other chases that used all 20 overs had mixed results. Some won, some lost.
The 247/9 used all 20 overs and lost. The 246/5 also consumed the full quota and lost.
Meanwhile, the 219/6 used 20 overs and won. Overconsumption doesn’t determine results.
What matters is the run rate during those overs. How fast teams scored in the available time.
Run Rate Comparison
| Score | Overs | Run Rate | Year | Opposition | Result |
|---|---|---|---|---|---|
| 247/9 | 20.0 | 12.35 | 2024 | DC | Lost |
| 246/5 | 20.0 | 12.30 | 2024 | SRH | Lost |
| 235/9 | 20.0 | 11.75 | 2021 | SRH | Won |
| 234/5 | 20.0 | 11.70 | 2024 | DC | Won |
| 228/5 | 20.0 | 11.40 | 2025 | GT | Won |
| 223/6 | 20.0 | 11.15 | 2017 | Kings XI | Lost |
| 219/6 | 20.0 | 10.95 | 2021 | CSK | Won |
| 218/7 | 20.0 | 10.90 | 2010 | Daredevils | Won |
| 218/5 | 20.0 | 10.90 | 2023 | GT | Won |
| 217/2 | 20.0 | 10.85 | 2025 | RR | Won |
| 216/4 | 18.5 | 11.46 | 2023 | Punjab | Won |
| 215/7 | 20.0 | 10.75 | 2025 | LSG | Won |
This table ranks all scores by run rate from fastest to slowest. The 12.35 rate stands alone at the top.
Five scores show run rates above 11.40 per over. These represent MI’s most aggressive batting displays.
Seven scores fall between 10.75-10.95. These demonstrate sustained consistency over full innings.
Overs Faced vs Total Runs
| Total Runs | Overs | Runs Per Over Needed | Actual Performance |
|---|---|---|---|
| 247 | 20.0 | 12.35 | Achieved |
| 246 | 20.0 | 12.30 | Achieved |
| 235 | 20.0 | 11.75 | Achieved |
| 234 | 20.0 | 11.70 | Achieved |
| 228 | 20.0 | 11.40 | Achieved |
| 223 | 20.0 | 11.15 | Achieved |
| 219 | 20.0 | 10.95 | Achieved |
| 218 | 20.0 | 10.90 | Achieved |
| 217 | 20.0 | 10.85 | Achieved |
| 216 | 18.5 | 11.46 | Exceeded |
| 215 | 20.0 | 10.75 | Achieved |
Every score achieved or exceeded the required run rate. This shows excellent execution across all innings.
The 216 in 18.5 overs exceeded the requirement. MI scored faster than needed while chasing.
All 20-over innings matched the exact requirements. Teams paced their scoring perfectly.
Batting First vs Chasing Run Rates
Batting First Run Rates
Seven times MI batted first scoring 215+. Run rates ranged from 10.75 to 11.75.
The 235/9 showed highest batting-first rate at 11.75. This came in Abu Dhabi 2021.
The 234/5 had 11.70 rate while batting first. Very close to the fastest.
The 228/5 produced 11.40 rate batting first. Third-fastest in this category.
Three batting-first scores showed 10.85-10.90 rates. These were 218/7, 218/5, and 217/2.
Slowest batting-first rate was 10.75 for the 215/7. Still maintained a crucial 10+ threshold.
Average batting-first run rate across seven matches: 11.18 per over.
Chasing Run Rates
Five chasing efforts produced different rate patterns. Range spread from 10.95 to 12.35.
MI highest score in IPL scorecard shows 247/9 with 12.35 rate while chasing. Fastest ever.
The 246/5 chase had 12.30 rate. Second-fastest chasing performance.
The 223/6 chase showed 11.15 rate. Third-fastest chasing effort.
Two successful chases had lower rates. The 219/6 showed 10.95 rate.
The 216/4 chase had 11.46 rate in reduced overs. Efficient chasing.
Average chasing run rate across five matches: 11.64 per over.
Batting First vs Chasing Run Rates
| Batting Position | Matches | Avg Run Rate | Highest RR | Lowest RR | Win % |
|---|---|---|---|---|---|
| Batting First | 7 | 11.18 | 11.75 | 10.75 | 100% |
| Chasing | 5 | 11.64 | 12.35 | 10.95 | 40% |
Chasing produced a higher average run rate at 11.64. Batting first averaged 11.18.
The difference of 0.46 runs per over seems small. But it reveals that chasing creates urgency.
Teams chase faster because they know the exact targets. Batting first requires calculated risk.
However, batting first showed a 100% win rate. Slower but more successful approach.
Chasing had only 40% success despite faster scoring. Speed didn’t guarantee victories.
Scoring Efficiency Analysis
Efficiency measures how well teams convert overs into runs. Higher rates show better efficiency.
The 247/9 converted 20 overs into 247 runs. Efficiency: 12.35 runs per over used.
This represents peak efficiency among all MI innings. Every over produced maximum runs.
The 216/4 in 18.5 overs showed special efficiency. Early finish with high total.
Converting 18.5 overs into 216 runs demonstrates superior planning. Target achieved with balls remaining.
Full 20-over innings showed varied efficiency. From 10.75 to 12.30 runs per over.
Lower efficiency scores still crossed 215. The 215/7 at 10.75 rate proves this.
Consistent 10.75+ efficiency over 20 overs produces competitive totals. Teams don’t need 12+ rates always.
Wickets Lost Impact on Run Rate
Highest MI Scores In IPL History show different wicket patterns. From 2 to 9 wickets lost.
The 217/2 lost only 2 wickets while scoring at 10.85. Conservative but effective.
The 247/9 lost 9 wickets while scoring at 12.35. Aggressive at cost of wickets.
No clear correlation exists between wickets lost and run rate. Both patterns work.
Lower wicket totals (2-5 wickets) averaged 11.34 run rate. Six matches in this category.
Higher wicket totals (6-9 wickets) averaged 11.56 run rate. Six matches here too.
The difference of 0.22 runs per over is minimal. Wicket preservation doesn’t slow scoring significantly.
Teams can score fast with or without losing wickets. Strategy matters more than wickets.
High-Score Efficiency
| Score | Wickets | Run Rate | Wickets/Over | Efficiency Score |
|---|---|---|---|---|
| 247/9 | 9 | 12.35 | 0.45 | High RR, High Wickets |
| 246/5 | 5 | 12.30 | 0.25 | High RR, Low Wickets |
| 235/9 | 9 | 11.75 | 0.45 | Good RR, High Wickets |
| 234/5 | 5 | 11.70 | 0.25 | Good RR, Low Wickets |
| 228/5 | 5 | 11.40 | 0.25 | Good RR, Low Wickets |
| 223/6 | 6 | 11.15 | 0.30 | Good RR, Medium Wickets |
| 219/6 | 6 | 10.95 | 0.30 | Medium RR, Medium Wickets |
| 218/7 | 7 | 10.90 | 0.35 | Medium RR, Medium Wickets |
| 218/5 | 5 | 10.90 | 0.25 | Medium RR, Low Wickets |
| 217/2 | 2 | 10.85 | 0.10 | Medium RR, Very Low Wickets |
| 216/4 | 4 | 11.46 | 0.21 | Good RR, Low Wickets |
| 215/7 | 7 | 10.75 | 0.35 | Medium RR, Medium Wickets |
This table combines run rate with wicket loss rate. Different efficiency patterns emerge.
High run rate with low wickets (246/5, 234/5, 228/5) shows ideal batting. Fast scoring with stability.
High run rate with high wickets (247/9, 235/9) shows aggressive risk-taking. Speed at any cost.
Medium run rate with very low wickets (217/2) shows a conservative approach. Safe accumulation.
Year-Wise Run Rate Evolution
- 2010 Performance
The 218/7 scored at a 10.90 rate. The early IPL era showed this as fast scoring.
Modern standards consider 10.90 as moderate. Evolution has changed perceptions.
- 2017 Performance
The 223/6 at 11.15 rate pushed boundaries higher. Faster than the 2010 standards.
Still below modern 12+ rates. But showed progression in scoring speeds.
- 2021 Performance
Two scores appeared: 235/9 at 11.75 and 219/6 at 10.95 rates.
The 11.75 rate approached modern aggressive standards. Significant improvement from earlier years.
- 2023 Performance
Two scores: 218/5 at 10.90 and 216/4 at 11.46 rates.
The 11.46 rate in reduced overs showed efficiency. Speed is maintained while chasing.
- 2024 Performance
Three scores with rates of 12.35, 12.30, and 11.70. Peak scoring year.
Two rates exceeded 12 per over. MI reached its fastest scoring levels.
- 2025 Performance
Three scores at 11.40, 10.85, and 10.75 rates. Slight decrease from 2024.
Still maintained above 10.75 minimum. Consistent scoring continues.
Over-Wise Scoring Patterns
All innings except one used complete 20 overs. This shows the standard T20 approach.
Early overs are likely to see powerplay scoring. First 6 overs determine momentum.
Middle overs maintain the run rate. Overs 7-15 require consistent scoring.
Death overs accelerate totals. Final 5 overs boost overall run rates.
The highest MI Scores In IPL History required strong death-over batting. Reaching 12+ rates needs late acceleration.
The 247/9 and 246/5 definitely had explosive death overs. 12+ rates are impossible without this.
Moderate rates around 10.85 suggest steady throughout. Less dramatic acceleration is needed.
Statistical Trends in Run Rates
Modern IPL sees higher run rates. The 12.30+ rates came only in 2024.
Earlier seasons maxed at an 11.75 rate. Batting evolution continues across years.
Chasing produces faster rates on average. Teams know targets and attack accordingly.
Defending sees more calculated approaches. Teams bat conservatively to avoid collapse.
Yet defending works better for MI. Despite slower rates, all batting-first innings won.
This proves that strategy beats speed. Smart cricket outperforms pure aggression.
Conclusion:
Highest MI Scores In IPL History show run rates from 10.75 to 12.35. This 1.6 range reveals different batting approaches.
Fastest rates above 12 per overcame while chasing. Both resulted in losses despite speed.
Moderate rates between 10.75-11.75 while batting first showed 100% success. Consistency worked better than extremes.
Only one match finished before 20 overs. The 216/4 in 18.5 overs demonstrated efficient chasing.
The average run rate across all twelve matches stands at 11.39 per over. This represents elite T20 batting.
These run rate statistics prove MI maintains scoring speeds consistently above 10.7 runs per over in their biggest totals.
Also Check:
- Most Expensive Player in IPL 2026
- Richest IPL Team
- IPL Winning Captains List 2008 to 2025
- IPL 2026 Trade Players List
- Most Unsuccessful Team In IPL History
About the Author